XBee Kill-A-Watt Power Measurement System
02 Jun 2013
Update: For the hardware-hacking enthusiasts, there’s an more in-depth post about building a XBee Kill-a-Watt transmitter (with lots of pics): XBee Kill-a-Watt Transmitter.
XBee Kill-a-Watt Power Measurement
I first found the project on Element14’s community site, and that lead me to the original Adafruit design. The ComEd Smart Grid has been in the news lately so the idea of monitoring power consumption was intriguing. A coworker passed me a link to ElectriSense, a University of Washington project, which further fueled my interest.
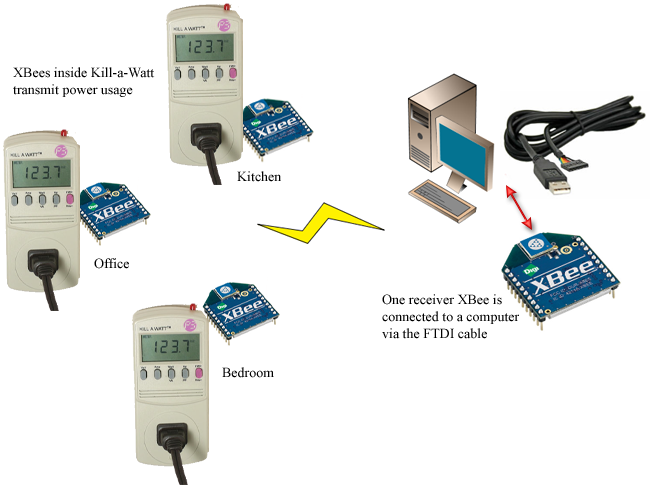
The overall system view (above) is comprised of a single receiver and several transmitters, all relying on XBee wireless communication. XBee modules have built-in A-D converters, so in this system the transmitters are programmed to sample analog values from a specific pin and broadcast those along with an identifier. If you wanted to have discrete networks of XBees, setting discrete PAN IDs would do the trick.
Hardware
I ordered the Tweet-a-Watt Starter Pack and followed the guide on how to assemble the parts. The process is pretty straight forward, but took several hours. I tend to take frequent breaks since my makeshift soldering station is uncomfortable at best, so your mileage may vary. The first piece of the system you construct is the receiver. Essentially this is a standard XBee adapter.

Each XBee module, whether it’s a receiver or transmitter, needs to be programmed via the adapter and FTDI cable. I had trouble getting the XBees to consistently write firmware successfully. I did not find a true solution to this, but was successful after successive tries.
The second piece is the transmitter. LadyAda’s guide has a very detailed step-by-step guide for the transmitter, though you may find that some steps vary due to revised Kill-a-Watt parts. The P3 Kill-a-Watt unit I purchased was a P4400.1. This revision has an updated PCB and smaller quad op-amp that you have to solder into. There is no known way to tell which version of the P4400 you’re ordering when you order online, though I would assume any models purchased at this time would be P4400.1’s.
Update: I built a second transmitter and posted about it here. There are several pictures of the process.
Software
The Python Serial and XBee libraries are used to pull the analog samples from the XBee receiver module. I adapted LadyAda’s wattcher.py from GitHub for my needs. I deleted the App Engine and Twitter code and added some code that pushes to Graphite.
Here’s my adapted wattcher.py:
Lines 170-181 is the Graphite part. I’m no python expert so there could easily be a better way to achieve this. For now it works, so the code cleanup will have to wait.
Calibration
An important part of the process is to calibrate the script to adjust for the power consumed by the XBee inside the Kill-a-Watt. To do this, run ./wattcher.py -d, which toggles on debug mode. The output will contain a line that looks like the following:
ampdata: [498, 498, 498, 498, 498, 498, 498, 498, 498, 498, 498, 498, 498, 498, 497, 498, 498, 498]
From this data we can determine what the sensor vrefcalibration values should be on lines 16 to 21. My transmitter registered an average close to 492, and the calibration made a noticeable difference in the measured output.
Graphing
I had originally wanted to use Google Powermeter to log and graph my data, but the service was taken retired in 2011. I immediately turned to Graphite. We use Graphite at work and although I’ve never had to set it up by hand, using Chef to stand up an instance is super easy (Update: I posted about my Vagrant, Graphite and StatsD setup). Once I had the Graphite server running, the additional python was pretty easy:
sock = socket()
try:
    sock.connect( (DEFAULT_CARBON_SERVER, DEFAULT_CARBON_PORT) )
except:
    print "WARNING: Couldn't connect to %(server)s on port %(port)d, is graphite running?" % { 'server':server, 'port':port }

if (sensorhistory.sensornum == 1):
    message = "%s %s %s" % ("wattage.office.watts", sensorhistory.avgwattover5min(), int(time.time()))
sock.sendall(message + "\n")
sock.close()
The script currently pushes only the 5 minute average wattage (once every five minutes), but I intend to update that to 1 minute averages every minute. Once you accumulate some data, the graphs become quite informative.

My home office consumes a baseline of about 215 watts. This includes two desktops, two 24” monitors, a laptop (sometimes), two printers, speakers, a modem, a router, a switch and various other peripherals, so I’m actually surprised at how low the power consumption is at idle and now little that changes when they’re in use. It’ll be interesting to gather more data comparing these devices’ power draw and how it compares to other areas in the house. I think my first target for comparison will be the media console.
The Completed System
All-in-all this was a really fun project. It’s a easily attainable mix of hardware and software hacking, and the fact that I get to graph some metrics at the end of the day is icing on the cake. I know I probably could have purchased a system that performs similar tasks, but the act of making satisfied the computer engineer in me.
If you got this far, thanks for reading!