Pushing Web Server Response Codes into Graphite with Logstash
27 Nov 2013
As web app developers, our first experiences pulling data from web server logs is often with piped unix commands - but there’s a better way! I leveled up to log data aggregation with Logster, but ultimately moved on to Logstash. Logstash provides a clean and easy to understand DSL for shipping, parsing and stashing logs. What attracted me to Logstash was it’s ease of integration into Elasticsearch and the resulting capability to query logs without predefining the queries.
Sending Web Server Response Codes to Graphite
Let’s say you want to monitor the counts and distribution of response codes logged by a web server. For the purposes of this example, we’ll be sending Nginx response codes to Graphite via StatsD using Logstash. I’ll focus on the Logstash configuration, but if you want to stand up Graphite & StatsD quickly, check this out.
The Logstash configuration DSL has three main sections: input, filter & output. Think of these as three operations along an event processing pipeline. What each section does is defined by plugins, which can be summarized as data streams or transforms. I use file, grok, statsd and elasticsearch for this example. You can find much more documentation here.
Here’s the logstash.conf file:
The input section is pretty self explanatory. The one thing that is important to understand is that type is used in the filter section to determine which filters will take action on that data.
The filter section is deceptively simple. Grok is community jargon for comprehensive understanding, but it is also a tool for pattern matching. The COMBINEDAPACHELOG is a grok pattern provided by Logstash and in this case is used to define all the data in the message. I’ll go into greater detail below.
The output section specifies two destinations with a third commented out. The statsd configuration specifies where the StatsD server lives and what action to take. In this case, it will increment a counter per each host and response code. The elasticsearch output is telling Logstash to send all the data to an embedded Elasticsearch instance. More about that below as well.
Assuming you have the Logstash jar and the configuration file in the same directory, you can use the following command to run Logstash:
java -jar logstash-1.2.2-flatjar.jar agent -f logstash.conf -- webThe agent parameter tells Logstash to run the inputs, filters and outputs while web runs Kibana. More about Kibana later. You’ll notice that it takes a few seconds to start up and that there’s some status information on the plugins that we’re using. Interestingly, the logging doesn’t look anything like logs configured with log4j. That’s because Logstash is actually written in Ruby and packaged as a jar with JRuby for portability and ease of install. If you get a really funky stacktrace from the jar that contains Ruby references, that’s why.
If everything is setup correctly, you’ll get info like this in Graphite:
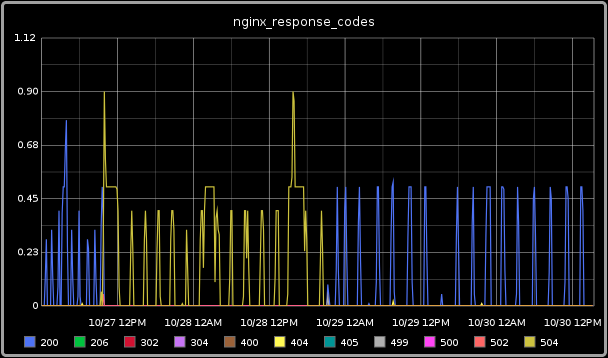
Pretty nifty, eh? As you can see, this snapshot includes a long period where the primary server response was a 404, which made this time range more interesting than others.
Grok Parsing
The grok filter is a key part to why this works with so little configuration. I glossed over why COMBINEDAPACHELOG worked for the Nginx access log, so lets have a deeper look. The definition looks like this:
COMBINEDAPACHELOG %{COMMONAPACHELOG} %{QS:referrer} %{QS:agent}Ok, so it’s COMMONAPACHELOG plus referrer and user agent. COMMONAPACHELOG looks like this:
COMMONAPACHELOG %{IPORHOST:clientip} %{USER:ident} %{USER:auth} \[%{HTTPDATE:timestamp}\] "(?:%{WORD:verb} %{NOTSPACE:request}(?: HTTP/%{NUMBER:httpversion})?|%{DATA:rawrequest})" %{NUMBER:response} (?:%{NUMBER:bytes}|-)What you’re looking at is aliased grok patterns and corresponding field names. Each data type is actually just a regex, which you can see in the grok patterns file. For example, IPORHOST resolves to (?:%{HOSTNAME}|%{IP}). HOSTNAME is a rather long regex while IP is further broken down into IPV4 and IPV6.
IPV6 ((([0-9A-Fa-f]{1,4}:){7}([0-9A-Fa-f]{1,4}|:))|(([0-9A-Fa-f]{1,4}:){6}(:[0-9A-Fa-f]{1,4}|((25[0-5]|2[0-4]\d|1\d\d|[1-9]?\d)(\.(25[0-5]|2[0-4]\d|1\d\d|[1-9]?\d)){3})|:))|(([0-9A-Fa-f]{1,4}:){5}(((:[0-9A-Fa-f]{1,4}){1,2})|:((25[0-5]|2[0-4]\d|1\d\d|[1-9]?\d)(\.(25[0-5]|2[0-4]\d|1\d\d|[1-9]?\d)){3})|:))|(([0-9A-Fa-f]{1,4}:){4}(((:[0-9A-Fa-f]{1,4}){1,3})|((:[0-9A-Fa-f]{1,4})?:((25[0-5]|2[0-4]\d|1\d\d|[1-9]?\d)(\.(25[0-5]|2[0-4]\d|1\d\d|[1-9]?\d)){3}))|:))|(([0-9A-Fa-f]{1,4}:){3}(((:[0-9A-Fa-f]{1,4}){1,4})|((:[0-9A-Fa-f]{1,4}){0,2}:((25[0-5]|2[0-4]\d|1\d\d|[1-9]?\d)(\.(25[0-5]|2[0-4]\d|1\d\d|[1-9]?\d)){3}))|:))|(([0-9A-Fa-f]{1,4}:){2}(((:[0-9A-Fa-f]{1,4}){1,5})|((:[0-9A-Fa-f]{1,4}){0,3}:((25[0-5]|2[0-4]\d|1\d\d|[1-9]?\d)(\.(25[0-5]|2[0-4]\d|1\d\d|[1-9]?\d)){3}))|:))|(([0-9A-Fa-f]{1,4}:){1}(((:[0-9A-Fa-f]{1,4}){1,6})|((:[0-9A-Fa-f]{1,4}){0,4}:((25[0-5]|2[0-4]\d|1\d\d|[1-9]?\d)(\.(25[0-5]|2[0-4]\d|1\d\d|[1-9]?\d)){3}))|:))|(:(((:[0-9A-Fa-f]{1,4}){1,7})|((:[0-9A-Fa-f]{1,4}){0,5}:((25[0-5]|2[0-4]\d|1\d\d|[1-9]?\d)(\.(25[0-5]|2[0-4]\d|1\d\d|[1-9]?\d)){3}))|:)))(%.+)?
IPV4 (?<![0-9])(?:(?:25[0-5]|2[0-4][0-9]|[0-1]?[0-9]{1,2})[.](?:25[0-5]|2[0-4][0-9]|[0-1]?[0-9]{1,2})[.](?:25[0-5]|2[0-4][0-9]|[0-1]?[0-9]{1,2})[.](?:25[0-5]|2[0-4][0-9]|[0-1]?[0-9]{1,2}))(?![0-9])
IP (?:%{IPV6}|%{IPV4})
HOSTNAME \b(?:[0-9A-Za-z][0-9A-Za-z-]{0,62})(?:\.(?:[0-9A-Za-z][0-9A-Za-z-]{0,62}))*(\.?|\b)
IPORHOST (?:%{HOSTNAME}|%{IP})
If your needs are more unique, the grok filter documentation shows how to create custom fields or even whole customized pattern files.
Now let’s have a look at an example log entry and see what the Grok filter does with it. Here’s the log entry:
10.0.0.1 - - [28/Nov/2013:11:01:31 -0600] "GET / HTTP/1.1" 200 303 "-" "Mozilla/5.0 (X11; Linux x86_64) AppleWebKit/537.36 (KHTML, like Gecko) Ubuntu Chromium/30.0.1599.114 Chrome/30.0.1599.114 Safari/537.36"Notice how the COMBINEDAPACHELOG pattern matches with the syntax of the log entry. If we uncomment the stdout { codec => rubydebug } output, we can see how the parsed log entry is turned into an event:
{
        "message" => "10.0.0.1 - - [28/Nov/2013:11:01:31 -0600] \"GET / HTTP/1.1\" 200 303 \"-\" \"Mozilla/5.0 (X11; Linux x86_64) AppleWebKit/537.36 (KHTML, like Gecko) Ubuntu Chromium/30.0.1599.114 Chrome/30.0.1599.114 Safari/537.36\"",
     "@timestamp" => "2013-11-28T17:01:32.003Z",
       "@version" => "1",
           "type" => "nginx-access",
           "host" => "lanyonm-linux",
           "path" => "/var/log/nginx/access.log",
       "clientip" => "10.0.0.1",
          "ident" => "-",
           "auth" => "-",
      "timestamp" => "28/Nov/2013:11:01:31 -0600",
           "verb" => "GET",
        "request" => "/",
    "httpversion" => "1.1",
       "response" => "200",
          "bytes" => "303",
       "referrer" => "\"-\"",
          "agent" => "\"Mozilla/5.0 (X11; Linux x86_64) AppleWebKit/537.36 (KHTML, like Gecko) Ubuntu Chromium/30.0.1599.114 Chrome/30.0.1599.114 Safari/537.36\""
}
The individual fields can be used in the output section to send select information to tools like StatsD. It’s now very clear how increment => "%{host}.nginx.response.%{response}" gets populated.
Elasticsearch & Kibana
This is where the magic happens. Without going into too much detail, Elasticsearch accepts this semi-structured data and builds searchable indexes for it. It becomes very easy to answer questions like, “how many non-2xx level error codes have we gotten per unique IPs?” If you want to hear more about how the query language works or how it handles large volumes of data, check out the website. The embedded Elasticsearch instance will persist data in a data folder in the same location Logstash is run.
Kibana is the super-slick web interface built on top of Elasticsearch. It provides that very necessary visualization on top of the json responses that Elasticsearch provides. The web option of the Logstash startup command runs Kibana on port 9292. This is what it looks like:
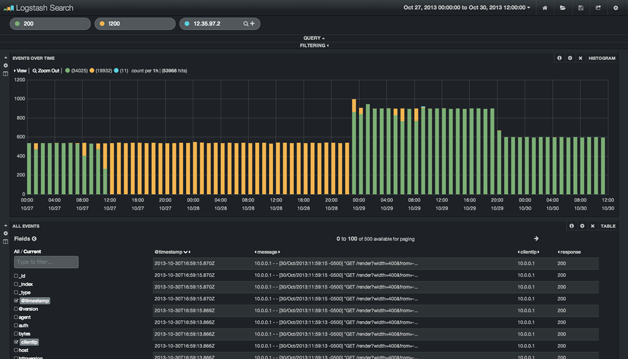
You’ll notice how the data is similar to the Graphite picture above. Unlike Graphite, Elasticsearch has indexed all the log data and you can therefore ask questions you had not prepared to answer prior to collecting the data (as would be the constraint with Graphite).
A tool like Elasticsearch coupled with Kibana makes log data much more operationally potent. For example, you could easily keep an eye on auditd logs for atypical access attempts. Similarly you could watch your website administration pages for IPs outside of the typical users. When used with log4j configured logs, the multiline input plugin will collapse a multi-line stacktrace into a single event. Elasticsearch would then be able to count the occurrences of each error, display frequency, and potentially even geo-locate if you get fancy with your web server logs.
The Business Proposition
Logstash and it’s companion tools like Elasticsearch and Kibana can transform logs from a stale and sometimes inaccessible disk-space liability into an operational advantage. The log data in the Kibana dashboard can be near real-time and the flexibility of Elasticsearch’s query interface makes asking big questions easy. Having this information at your fingertips will give you an operation edge.