A Go Program to Collect HTTP Stats
29 Mar 2015
I tried Golang a couple years ago but didn’t see an immediate use for it my work. Fast-forward to February 2015 and add an inspiring blog post by the UK GDS, and I was ready to give Golang another go. The GDSTeam’s event-store project was a perfectly sized stepping stone for getting back into Golang. I’m passionate about WebPerf and therefore the idea of writing a Go program to collect Navigation Timing API data was a natural choice.
I had collected Navigation Timing API data in the past, but not in a microservice-esque, reusable way. For example, I had previously built a controller and service into a Grails application to ingest Navigation Timing data and forward it along to StatsD. The idea of building a small, reusable service that collects http statistics appealed to me.
The Idea
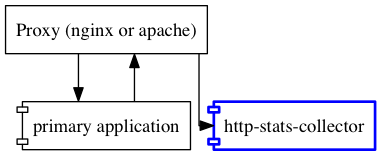
The general goal was to collect general HTTP statistics, with the first candidate being Navigation Timing data. The rough design of the application is to listen on several content routes that are proxied by the same web server as the primary application. It wasn’t clear from the Event Store project exactly how GDSTeam deploys their application, but this made sense as a proof of concept to me.
http-stats-collector
The application design evolved as I developed, but as of this writing there are two main components: handlers and recorders. The handlers are HttpFuncHandlers that do the very basic parsing and validation of the HTTP routes. These functions are passed an array of recorder interfaces that implement the functions called by each handler. It’s all kinda confusing in words, so let’s jump into the code.
The Handlers
Here’s a excerpt from handlers.go:
1
2
3
4
5
6
7
8
9
10
11
12
13
14
15
16
17
18
19
20
21
22
23
24
25
26
27
28
29
30
31
32
33
34
35
36
37
38
39
40
41
42
43
44
45
46
47
48
49
50
51
type NavTimingReport struct {
  Details   NavTimingDetails `json:"nav-timing" statName:"navTiming"`
  Page      string           `json:"page-uri" statName:"pageUri"`
  Referer   string           `statName:"referer"`
  UserAgent string           `statName:"userAgent`
}

type NavTimingDetails struct {
  DNS      int64 `json:"dns" statName:"dns"`
  Connect  int64 `json:"connect" statName:"connect"`
  TTFB     int64 `json:"ttfb" statName:"ttfb"`
  BasePage int64 `json:"basePage" statName:"basePage"`
  FrontEnd int64 `json:"frontEnd" statName:"frontEnd"`
}

func NavTimingHandler(recorders []Recorder) http.HandlerFunc {
  return func(w http.ResponseWriter, req *http.Request) {
    var timing NavTimingReport

    if req.Method != "POST" {
      http.Error(w, "Method not allowed", http.StatusMethodNotAllowed)
      w.Header().Set("Allow", "POST")
      return
    }

    if err := json.NewDecoder(req.Body).Decode(&timing); err != nil {
      http.Error(w, "Error parsing JSON", http.StatusBadRequest)
      return
    }

    // You could consider this a flaw, but we don't send the stat anywhere
    // if it can't go to one of the recorders.
    for _, recorder := range recorders {
      if !recorder.validStat(timing.Page) {
        http.Error(w, "Invalid page-uri passed", http.StatusNotAcceptable)
        return
      }
    }

    // for each recorder we're sending all the NavTimingDetails stats
    t := reflect.TypeOf(timing.Details)
    v := reflect.ValueOf(timing.Details)
    for i := 0; i < v.NumField(); i++ {
      for _, recorder := range recorders {
        stat := recorder.cleanURI(timing.Page) + t.Field(i).Tag.Get("statName")
        val := v.Field(i).Int()
        recorder.pushStat(stat, val)
      }
    }
  }
}
As you can see, there are two structs, one nested within the other. The NavTimingReport represents the JSON received in the request body (documented in the readme along with a snippet of javascript that could be used to send the information from the browser to the server).
The first several lines of NavTimingHandler is boilerplate HTTP method checking and decoding the JSON request body into a struct. I should note that I used the json.NewDecoder() implementation because it was easier to unit test than the ioutil.ReadAll() + json.Unmarshal combination found in the GDSTeam’s event-store.
Line 33 above is where things get interesting. validStat is a method on the Recorder interface which gives the Recorder the ability to reject a stat for any reason. As is documented in the code, there’s a deficiency in the design because if a single Recorder rejects the stat, processing is halted for all Recorders and an error returned to the caller.
The last thing the handler does is call cleanURI and pushStat. As before these methods are provided by the Recorder, but I’m unhappy with this implementation because of the way it exposes more than necessary to the handler. More on that below. The interesting part of these loops is how reflection is used to pull certain statNames and values from the NavTimingDetails. Additionally, in a few cases the JSON field is named (slightly) differently than how I’d like to name the stats that are pushed to the Recorder:
Page string `json:"page-uri" statName:"pageUri"`This allows the separation the field name used within the JSON in the HTTP body from the stat name used by pushStat. Pretty nifty.
The Recorders
Recorder is an interface that provides three methods:
type Recorder interface {
  pushStat(stat string, value int64) bool
  cleanURI(input string) string
  validStat(stat string) bool
}
The method names are hopefully pretty self-explanatory, but there’s documentation in each implementation to give more detail. This interface is based on the needs of the StatsD client, but I’m sure it could accommodate other statistic processing or storage APIs.
It may be easier to just read the full recorders.go given the brevity of the implementation, but I’ll review the detail of each implementation for the StatsDRecorder below.
pushStat
The StatsD implementation of pushStat simply wraps cactus’s StatsD client. This works with the v1.0.0 version of the dependency.
// Push stats to StatsD.
// This assumes that the data being written is always timing data and we are
// always collecting all the samples.
func (statsd StatsDRecorder) pushStat(stat string, value int64) bool {
  if statsd.Statter != nil {
    err := statsd.Statter.Timing(stat, value, 1.0)
    if err != nil {
      log.Fatal("there was an error sending the statsd timing", err)
      return false
    }
  }
  return true
}
The only two things to note here are that the code above takes care of using a Timer and does not downsample (the “1.0” arguement in Timing()).
cleanURI
This is where the code-smell is coming from. For StatsD, I combine the page-uri sent in the JSON with the type of stat: dns, connect, ttfb, basePage, or frontEnd. To differentiate from a page ending in / and other pages, I append index to URIs ending in /, as well as take care of stripping away any unwanted file extensions. I’m not convinced this method would survive refactoring to add a second Recorder, but it does a decent job for StatsD. You can see the implementation here, and I’ll cover testing below.
validStat
In past Navigation Timing API collection efforts, the team learned that it’s important for a web stats collection agent to be able to make decisions about what is valid data and what is not. The endpoint will be open to the internet after all…
// The valid page-uri checker for StatsD.  We don't want to accept anything
// that the storage would have trouble handing.
func (statsd StatsDRecorder) validStat(stat string) bool {
  return !strings.ContainsAny(stat, "&#") && strings.Index(stat, "//") == -1
}
validStat currently does some very rudimentary make-sure-there’s-no-query-string checking, but it could be extended to read a file of whitelisted urls, etc.
Main.go
In a way, this is where the magic happens - but it’s also kinda boring. The list of Recorders is constructed and the Handler mounted to its URI.
var client statsd.Statter
client, err := statsd.NewClient(*statsHostPort, *statsPrefix)
if err != nil {
  log.Fatal(err)
}
defer client.Close()

recorders := []Recorder{StatsDRecorder{client}}
http.HandleFunc("/nav-timing", NavTimingHandler(recorders))
Flags
Let me take a bit of a detour to gush about how painless flags are to work with in Golang. If you’ve parsed input or created usage documentation for a commandline utility before, you know how painful and verbose it can be. Go makes this amazingly simple.
var (
  port          = flag.Int("port", 8080, "Server listen port.")
  statsHostPort = flag.String("statsHostPort", "127.0.0.1:8125", "host:port of statsd server")
  statsPrefix   = flag.String("statsPrefix", "http-stats-collector", "the prefix used when stats are sent to statsd")
)
flag.Parse()
Not only does this 6 line block take care of parsing the flags, but it generates the --help usage documentation for the executable and handles type checking. It’s pretty awesome coming from other languages where the arg parsing can overshadow the actual program.
Testing
If you go to the GitHub repo for this project you’ll see: ![]() . It easily took longer to gain this test coverage than it did to write the base program, but good tests are essential for open source projects and help me better understand the code I’ve written.
. It easily took longer to gain this test coverage than it did to write the base program, but good tests are essential for open source projects and help me better understand the code I’ve written.
When starting with a new language or framework I have found it is wise to search for and consume what information you can about what works. I found some references to rspec-like frameworks, but SoundCloud found that Go’s built-in testing package was sufficient for their needs. I was persuaded by a SoundCloud talk to stay away from any sort of testing framework. This gave me the confidence I needed to proceed without including a testing framework.
The Unit Tests
The handlers_test.go is relatively easy to read and understand what’s going on. I’m sure I could DRY out the code a bit. The basic test structure is:
func TestNavTimingHandlerSuccess(t *testing.T) {
  req, _ := http.NewRequest("POST", "/r", bytes.NewBufferString(timing_data))
  req.Header.Add("X-Real-Ip", "192.168.0.1")
  req.Header.Add("User-Agent", "Mozilla/5.0 (X11; Ubuntu; Linux x86_64; rv:36.0) Gecko/20100101 Firefox/36.0")
  resp := httptest.NewRecorder()

  NavTimingHandler(recorders)(resp, req)

  const expected_response_code = 200
  if code := resp.Code; code != expected_response_code {
    t.Errorf("received %v response code, expected %v", code, expected_response_code)
  }
}
The request is set up, response recorder constructed, and the Handler invoked. In this case the response code is compared to what’s expect and and error raised if that’s not the case.
The recorders_test.go is less elaborate because it’s just checking that validStat and cleanURI does what they’re supposed to.
Integration Debugging
I didn’t write an integration test per-se, but I did find StatsD dumpMessage mode to be hugely helpful. One might incorrectly assume that debug mode will print the received stats to the console, but some more careful scouring of the internet (and reading the documentation) will lead you to:
dumpMessages: trueThis allowed me to see that messages were making it to StatsD as I’d expected. Do not enable this in production.
Code Coverage
In addition to robust testing capabilities, Go ships with built-in code coverage. There are some nuances about how it calculates coverage that you’ll want to read, but here’s what I ended up using:
go test -race -covermode=count -coverprofile=coverage.out && go tool cover -html=coverage.outThe command will calculate coverage and then convert the result into an html report opened in your default browser. Again, pretty nifty.
Miscellaneous Tips
Makefile
I hadn’t written a Makefile in quite a while, but it was a natural way to chain commands together and ensure that tests were run every time the program was compiled, etc. Even if I became more comfortable with Go I think I’d continue using a Makefile because of how easy I can clean, test, build, and run. The full makefile is pretty self-explanatory.
Go Dependency Management - Status Pending
Golang’s dependency management is deficient. There’s lots of ranting on the internet about this if you’re interested in reading more, but I experienced this firsthand when I tried to clone and run on a different machine - and I got a compile error. The issue was that a breaking change was released for the StatsD client between the time I ran go get on the first machine and when I ran go get on the second machine. It is disappointing that Go doesn’t provide a built-in mechanism for handling this. There are good userland solutions out there, but it’s my understanding that Go 1.5 will have a solution, so I’m living dangerously in the meantime.
Go with Sublime Text
Syntax highlighting has become table-stakes, and the GoSublime package for ST2 takes it to another level. Most notably, GoSublime will run go fmt on every save, ensuring that your code is compliant with the default Go code formatting. I’ve seen several open source projects that have git hooks that perform the same function, so it seems quite common.
Go Interfaces
Before introducing the Recorder interface, I didn’t have very good separation of concerns. Jordan Orelli’s post on using Interfaces in Go was instrumental in getting myself up to speed.
Documentation and package main
The package main is intended to be used for executables and thus the documentation generation is slightly different than library packages. You can use godoc -http=:8080 to generate documentation and view it in a browser, but if you’re writing an executable don’t expect to see most of your in-code documentation.
Conclusion
Overall, this was an awesome side project. It didn’t take too long to complete and will be put to use as part of a stats collection pipeline at work. If you’ve gotten this far, I hope this post has helped spark your interest in embarking on a Go project or has answered a nagging question for you.