Log Aggregation with Log4j, Spring, and Logstash
29 Dec 2015
While parsing raw log files is a fine way for Logstash to ingest data, there are several other methods to ship the same information to Logstash. These methods each have trade-offs that may make them more or less suitable for your particular situation. I have posted about multiline tomcat log parsing before, and this post is an attempt to compare that and other methods I’ve explored: log4j as JSON, log4j over TCP, and raw log4j with the multiline codec.
These examples were developed on one machine but are designed to work in an environment where your ELK stack is on a separate machine/instance/container. In the multi-machine environment Filebeat (formerly logstash-forwarder) would be used in cases where the example uses the file input.
For posterity’s sake, these are the software versions used in this example:
- Java 7u67
- Spring 4.2.3
- Logstash 2.1.0
- Elasticsearch 2.1.1
- Kibana 4.3.1
I first began to author this post on Nov, 28th 2014, so please forgive any options presented that are no longer in favor. Also, you’ll notice that slf4j is used as an abstraction for log4j in the code samples.
Log4j As JSON
This method aims to have log4j log as JSON and then use Logstash’s file input with a json codec to ingest the data. This will avoid unnecessary grok parsing and the thread unsafe multiline filter. Seeing json-formatted logs can be jarring for a Java dev (no pun intended), but reading individual log files should be a thing of the past once you’re up and running with log aggregation. Also, you can run two appenders in parallel if you have the available disk space.
Instead of using a PatternLayout with a heinously complex ConversionPattern, let’s have a look at log4j-jsonevent-layout. The prospect of a solution that is entirely in configuration fits the bill, and I can live with yet another logging dependency.
Including the dependency in a pom.xml is quite easy:
<dependency>
    <groupId>net.logstash.log4j</groupId>
    <artifactId>jsonevent-layout</artifactId>
    <version>1.7</version>
</dependency>
The log4j.properties will look familiar, and I’ll explain UserFields in a bit.
log4j.rootLogger=debug,json

log4j.appender.json=org.apache.log4j.DailyRollingFileAppender
log4j.appender.json.File=target/app.log
log4j.appender.json.DatePattern=.yyyy-MM-dd
log4j.appender.json.layout=net.logstash.log4j.JSONEventLayoutV1
log4j.appender.json.layout.UserFields=application:playground,environment:dev
And the Logstash config is as you’d expect:
input {
  file {
    codec => json
    type => "log4j-json"
    path => "/path/to/target/app.log"
  }
}
output {
  stdout {}
}
The values set in the UserFields are important because they allow the additional log metadata (taxonomy) to be set in the application configuration. This is information about the application and environment that will allow the log aggregation system to categorize the data. Because we’re using the file input plugin we could also use add_field, but this would require separate file plugins statements for every application. Certainly possible, but even with configuration management more of a headache than the alternative. Also, the path parameter of the file plugin is an array so we can specify multiple files with ease.
If everything is set correctly, log messages should look like this in Kibana:
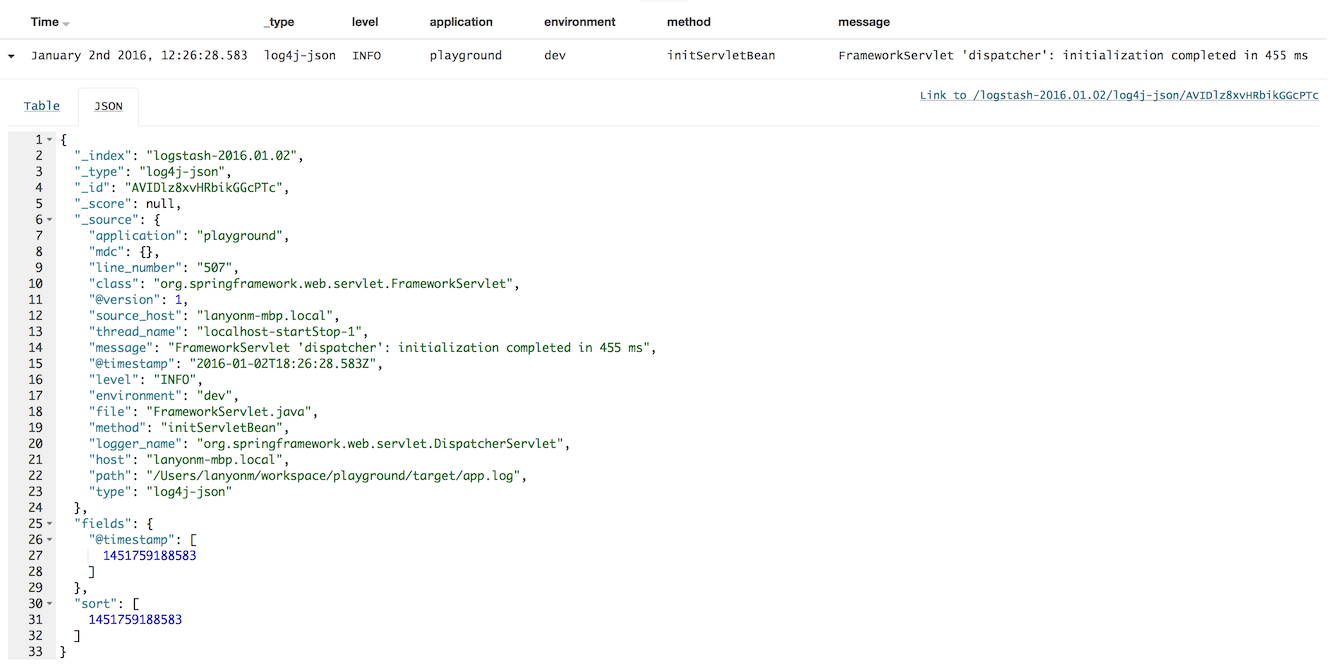
As you can see, the UserFields are parsed into Logstash fields. If you prefer these values to be set via command line and environment variable, the library provides a way that will override anything set in the log4j.properties.
Log4j over TCP
This method uses log4j’s SocketAppender and Logstash’s log4j input. Log events are converted into a binary format via the SocketAppender and streamed to the log4j input. The advantages here are that the new log4j appender can be added without additional dependencies and that we are able to avoid dealing with the multiline filter. Let’s look at the implementation before digging into the shortcomings.
Here’s a snippet of the log4j.properties:
log4j.rootLogger=debug,tcp

log4j.appender.tcp=org.apache.log4j.net.SocketAppender
log4j.appender.tcp.Port=3456
log4j.appender.tcp.RemoteHost=localhost
log4j.appender.tcp.ReconnectionDelay=10000
log4j.appender.tcp.Application=playground
And the corresponding snippet of Logstash config:
input {
  log4j {
    mode => "server"
    host => "0.0.0.0"
    port => 3456
    type => "log4j"
  }
}
output {
  stdout {}
}
One of the log4j configurations above that you rarely see is Application. When this parameter is set Logstash will parse it into an event field. This is handy, but may not satisfy your logging taxonomy - exposing one of this method’s shortcomings: tagging log events with application and environment identifying information. The way this is typically done in the Logstash config is with add_field on an input plugin. Taking the typical approach would mean a different input plugin/port for each java app sending logs - not fun to manage at scale!
Mapped Diagnostic Context
Mapped Diagnostic Context (MDC) provides a way to enrich standard log information via a map of values of interest. Thankfully the log4j plugin will parse MDC hashes into log event fields. The MDC is managed on a per-thread basis, but a child thread automatically inherits a copy of the MDC from it’s parent. This means that log taxonomy can be set to the MDC in the application’s main thread and affect every log statement for its entire lifespan.
Here’s minimalistic example:
import org.slf4j.Logger;
import org.slf4j.LoggerFactory;
import org.slf4j.MDC;

public class LoggingTaxonomy {

    private static final Logger log = LoggerFactory.getLogger(LoggingTaxonomy.class);

    static public void main(String[] args) {
        MDC.put("environment", System.getenv("APP_ENV"));
        // run the app
        log.debug("the app is running!");
    }
}
With a PatternLayout conversion pattern like %d{ABSOLUTE} %5p %c{1}:%L - %X{environment} - %m%n and APP_ENV set to dev you’d expect to see a log statement like:
15:23:03,698 DEBUG LoggingTaxonomy:34 - dev - the app is running!
How and where to integrate the MDC values will vary widely based on the framework used by the application, but every framework I’ve ever used has an appropriate place to set this information. In Spring MVC with Java Config it can go in one of the AppInitializer methods. There are additional uses for MDC, which I’ll write about in a future post.
Once all the code and config is correct, the enhanced logs will flow into your Kibana dashboard like so:
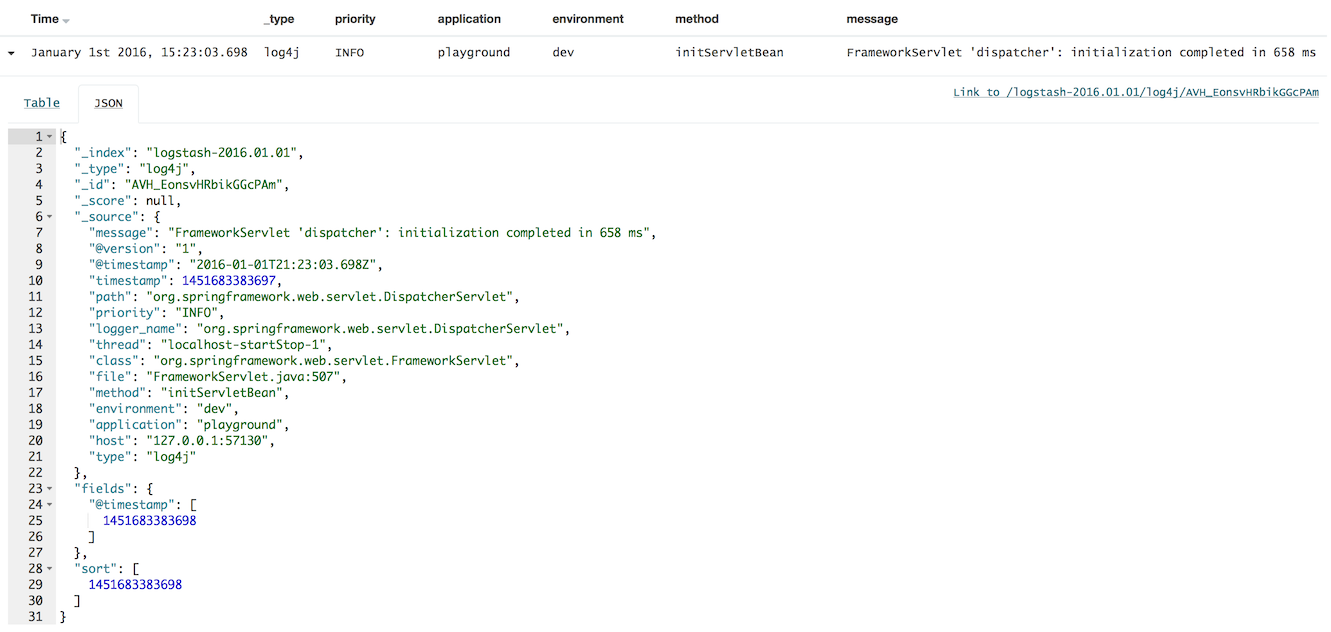
A few things to note about this approach:
- The logging level is stored in
priority, notlevelas is with log4j-jsonevent-layout - There is no
source_hostfield, so you may need to add that via MDC as well
Raw Log4j and the Multiline Codec
My multiline parsing post used the multiline filter plugin, but as mentioned above that plugin isn’t threadsafe. I wanted to provide a slight update to that approach that uses the multiline codec instead of the filter. I’ve modified the original example as little as possible and integrated the relevant bits into the playground app.
Here’s a snippet of the log4j.properties:
log4j.rootLogger=debug,file

log4j.appender.file=org.apache.log4j.DailyRollingFileAppender
log4j.appender.file.File=target/file.log
log4j.appender.file.layout=org.apache.log4j.PatternLayout
log4j.appender.file.layout.ConversionPattern=%d{yyyy-MM-dd HH:mm:ss,SSS ZZZ} | %p | %c - %m%n
And the corresponding snippet of Logstash config (the grok pattern file can be found here):
input {
  file {
    type => "raw-file"
    path => "/path/to/target/file.log"
    add_field => {
      "application" => "playground"
      "environment" => "dev"
    }
    codec => multiline {
      patterns_dir => "/path/to/logstash/patterns"
      pattern => "(^%{TOMCAT_DATESTAMP_PATTERN})|(^%{CATALINA_DATESTAMP_PATTERN})"
      negate => true
      what => "previous"
    }
  }
}
output {
  stdout {}
}
You’ll notice that I used add_field to add application and environment fields because adding those to the ConversionPattern and grok parsers would’ve required some heavy lifting. If I’d built-out this solution fully, I would have integrated these via MDC as described above and made the ConversionPattern and Grok parse updates.
The log message will look like this in Kibana:
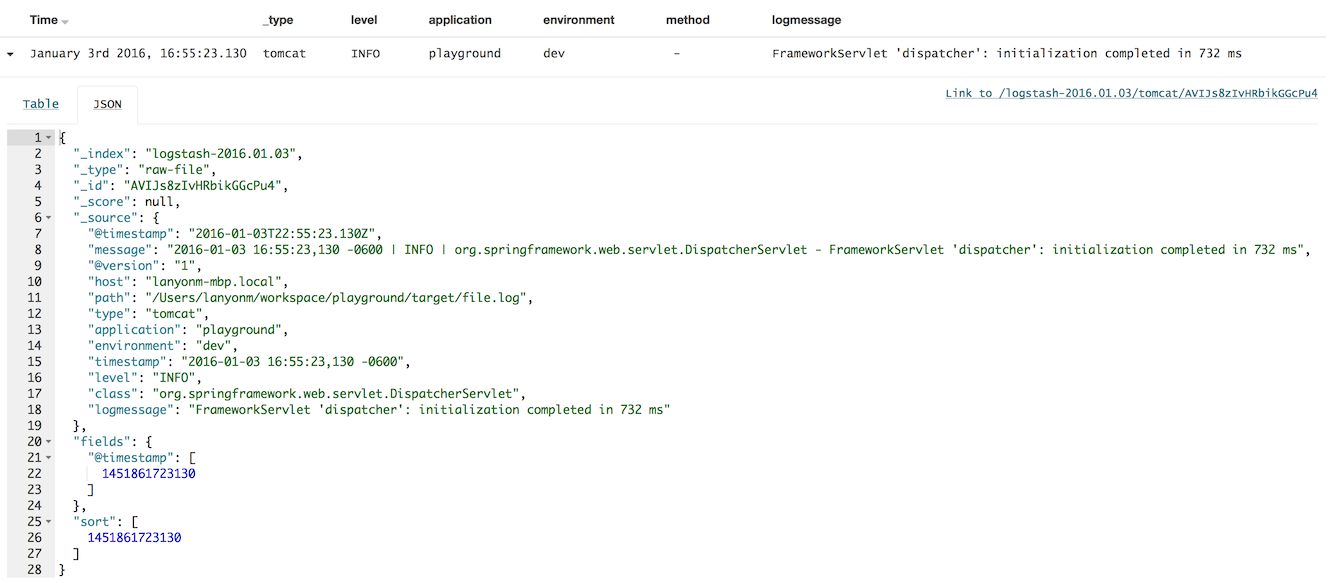
In my opinion there are several shortcomings to this approach:
- Creating multiline parsers can be tough.
- Grok parse patterns are tightly coupled to Conversion pattern and require adjustments in both places for changes.
- Developers won’t be able to add MDC information and have it automagically show up in the log aggregation system.
Other Options
Log4j isn’t the only logging solution for Java. Logback is growing in popularity and implements the slf4j API making it swappable with Log4j or JUL. The logstash-logback-encoder looks particularly robust. If you’re coming from a Log4j implementation be sure to use the LogstashTcpSocketAppender, not the LogstashSocketAppender. The latter uses UDP and debugging an incident where log messages may have been dropped is a recipe for disaster. Given more time this would be my next exploration.
Summary
I hope the comparison of these methods is helpful. If it’s not already clear, my preference is log4j as JSON using log4j-jsonevent-layout and Filebeat. Logstash-forwarder or Filebeat is already on many of our servers, so this is an easy approach for us. I’m interested to hear others’ experiences managing their log aggregation pipeline.